 |
||
| Scientists' Contributions | ||
TURBULENCE AND ADMIXTURE FLUXES IN THE
TROPO-STRATOSPHERE FROM BALLOON
AND RADAR MEASUREMENTS
N. M. Gavrilov1, H. Luce2, S. Fukao3 and F. Dalaudier4
1Atmospheric Physics Department, Saint-Petersburg State University, Russia. E-mail: gavrilov@pobox.spbu.ru
2LSEET-LEPI, Toulon-Var University, France. E-mail : Hubert.Luce@lseet.univ-tln.fr
3Research Institute for Sustainable Humanosphere, Kyoto University, Japan. E-mail: fukao@rish.kyoto-u.ac.jp
4Service d’Aéronomie, CNRS, France. E-mail : francis.dalaudier@aerov.jussieu.fr
Parameters of turbulence and gravity waves are estimated from high-resolution vertical profiles of temperature in the tropo-stratosphere obtained with instrumented balloons during the MUTSI (MU radar- Temperature Sheets and Interferometry) campaign near Shigaraki,, Japan, in May 2000. It is found that the intensities of gravity waves and turbulence frequently increase in the regions of increased large-scale and mesoscale temperature gradients. This may increase turbulent diffusive fluxes of admixtures near the tropopause. Examples of estimated turbulent ozone fluxes in the tropo-stratosphere from MU radar and ozonesondes data collected during a campaign in 1998 are considered and discussed in light of the MUTSI turbulence studies.
1. Introduction
Turbulence is an important subject in the atmospheric sciences. Dissipation of turbulent energy and turbulent viscosity and heat conduction are important for atmospheric energetic and dynamic processes. Turbulent mixing and diffusion of natural and anthropogenetic gas species control atmospheric composition. Effects of turbulence are now involved into practically all theoretical and numerical models of atmospheric circulation, dynamics, energetics and composition. Small-scale turbulence provides mixing of atmospheric gases and may produce turbulent ozone fluxes due to vertical gradients of ozone mixing ratio (Pavelin et al., 2002; Whiteway et al., 2003; Lamarque and Hess, 2003). In the present study, we use data of high-resolution balloon temperature measurements during MUTSI experiment in May 2000 also measurements with Japanese MU radar located in Shigaraki (35º N, 136º E) simultaneously with ozonesonde measurements in April 1998 to study gravity wave and turbulent characteristics of different vertical scales and to estimate diffusion ozone fluxes in the tropo-stratosphere.
2. Method of Data Analysis.
MUTSI balloons were equipped with four temperature sensors making measurements with height resolution down to 10 cm and typical accuracy of 2 - 3 mK. To estimate characteristics of temperature fluctuations of different scales, we extracted trends from balloon temperature profiles obtained with least-square approximations by polynomials of first and second orders at different height intervals of Ls, Lm and Ll, corresponding to small-scale, meso-scale and large-scale fluctuations, respectively. The temperature profiles obtained from these polynomial approximations allowed us obtaining vertical temperature gradients of different scales. Amplitudes of temperature fluctuations of different scales are characterized by relative standard deviations δTs /Ts, δTm /Tm, and δTl /Tl of departures of measured temperatures from mentioned polynomial fits within intervals Ls, Lm and Ll, respectively. In order to diminish secondary maxima of corresponding effective spectral filters, Gaussian and Hanning weighting functions were used. As far as cut-off vertical wavenumbers of the filters depend on the weight coefficients, we selected different thicknesses of fitting layers within intervals of Ls ~ 5 - 10 m, Lm ~ 100 - 200 m and Ll ~ 5 - 10 km to provide approximately equal cut-offs for all used weighting functions. Therefore, obtained small-scale, mesoscale and large-scale components may correspond to vertical scales of turbulent and wave processes of λs < 5 m, 5 < λm < 100 m and λl > 5 km, respectively.
Temperature fluctuations with scales of meters are estimated by structure functions D(r) = < (T(x+r)-T(x))2 > calculated for pairs of temperature sensors. The structure functions were estimated for separations of r = 1 m directed horizontally, vertically and average of them, DT. For estimation of turbulent ozone fluxes we estimated turbulent diffusivities from the MU radar data as described by Gavrilov et al. (2004). Vertical gradients of ozone concentration were obtained from simultaneous ozonesonde measurements in Shigaraki in April 1998.
3. Perturbations of Different Scales
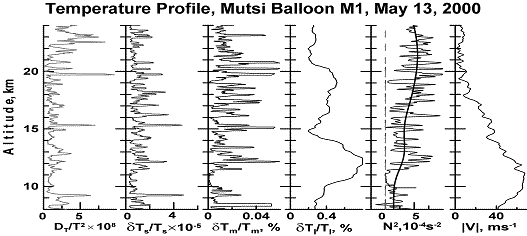
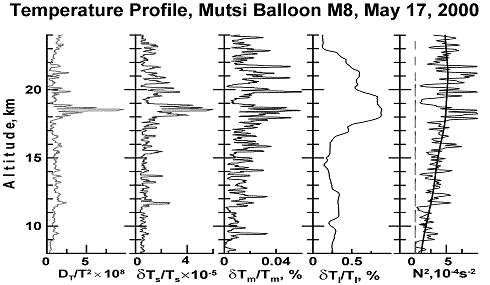
Fig. 1 and 2 show examples of vertical profiles for MUTSI balloons M1 and M8. Analysis shows that background squared Brunt-Vaïssälä frequency produced by large-scale atmospheric processes is small up to altitudes 8 - 9 km. Then it increases from the tropopause level and in the lower stratosphere up to 20 - 21 km and has high values above (see thick line in plot for N2 in Figures 1 and 2).

Figure 1. Vertical profiles (from left to right) of averaged and normalized temperature structure function at distance of 1 m; standard deviations for vertical scales less than 5m, 100 m and 5000 m; Squared Brunt-Vaïsälä frequencies for scales larger than 100 m (thin line) and 5000 m (thick line) filtered out from MUTSI balloon M1 data using Gaussian weight window function (see part 2), also magnitude of horizontal wind averaged over 200 m height intervals.
Large-scale δTl /Tl in Fig. 1 and 2 is maximum near the layers of growing and maximum Nl2 above the tropopause. For long non-dissipative waves this may be explained from conservation of wave action flux in the regions of growing Nl2 (see Gavrilov and Fukao, 2004). Maxima of standard deviations of mesoscale temperature variations in Fig. 1 and 2 show a good correspondence with maxima of mesoscale Brunt-Vaisala frequency Nm2. One can expect that mesoscale perturbations in our study may have substantial contribution from universal spectra of gravity waves in the atmosphere. Amplitudes of the universal spectrum depend on N2, this dependence being larger for wave temperature fluctuations. This may explain the observed correspondence between maxima of mesoscale temperature perturbations and Nm2 in Fig. 1 and 2.
Consideration of standard deviations of small-scale temperature perturbations (scales less than 5 m) and temperature structure function at separation of 1 m in Fig. 1 and 2 shows frequent occurrence of local maxima of δTs /Ts and DT/T2 in the regions of local maxima of mesoscale perturbations and maxima of Nm2. These perturbations may correspond to small-scale turbulence. Therefore, the correspondence, sometimes observed, may reflect a transfer of energy of mesoscale gravity waves to the energy of small-scale turbulence, which may occur due to instability of gravity waves and their nonlinear interactions and may be intensified in the regions of increased gravity wave activity in Fig. 1 and 2. Table 1 shows numbers of layers of maximum and minimum Nm2 observed with MUTSI balloons M1 and M8 and respective relative frequencies of occurrence of local maxima and minima of standard deviations of mesoscale and small-scale temperature perturbations. One can see that local maxima and minima of δTm, δTs and DT mainly correspond to respective maxima and minima of mesoscale Nm, especially in the stratosphere.

Figure 2. Same as Fig. 1, but for MUTSI balloon M8.
| Nm local maxima | Nm local minima | ||||
| Numbers, % | Z < 10 km | Z > 10 km | Numbers, % | Z < 10 km | Z > 10 km |
| N | 32 | 80 | N | 29 | 88 |
| max δTm, % | 94 | 96 | min δTm, % | 83 | 93 |
| max δTs, % | 78 | 95 | min δTs, % | 86 | 94 |
| max DT, % | 75 | 91 | min DT, % | 66 | 77 |
| min DT, % | <1 | <1 | max DT, % | 10 | 7 |
Table 1. Numbers of Observed Extremums of Nm and Corresponding Relative Occurrences of Extremums of Mesoscale and Small-scale Temperature Perturbations for MUTSI balloons M1 and M8
4. Statistical Characteristics
We studied histograms of characteristics of mesoscale and small-scale temperature variations separately for layers of mesoscale high stability (HS) and low stability (LS), where Nm > Nl and Nm < Nl, respectively. Such histograms for MUTSI balloons M1 and M8 are shown in Fig. 3. Respective mean values are given in Table 2. One can see that both mesoscale and small-scale temperature perturbations are stronger in HS regions, which correspond to Fig. 1 and 2. Two possible mechanisms of energy transfer from gravity waves to small-scale are discussed recently in the literature: wave shear and convective instability and energy cascade to smaller scales due to nonlinear wave interactions.
| Parameter | Lower Stability, Nm < Nl | Higher Stability, Nm > Nl |
| (δTm/Tm)X104 | 1.13 ± 2.88 | 2.18 ± 2.19 |
| (δTs /Ts)X105 | 0.60 ± 0.59 | 1.04 ± 1.28 |
| (DT /T2)X108 | 1.29 ± 1.40 | 2.19 ± 2.25 |
| (∂Tm /∂z), K/km | -4.47 ± 3.51 | 1.81 ± 4.68 |
| (∂Ts /∂z), K/km | -5.25 ± 5.15 | 2.45 ± 11.3 |
| Occurrence of ∂Ts /∂z < -10 K/km, % | 5.71 | 1.68 |
| Occurrence of ∂Ts /∂z > 10 K/km, % | 1.62 | 16.0 |
Table 2. Average Mesoscale and Small-scale Temperature Standard Deviations and Temperature Gradients for Layers of Lower and Higher Mesoscale Stabilities for Histograms of Fig. 3.
Histograms of small-scale gradients ∂Ts /∂z corresponding to vertical scales of 5 m shows a sharp decrease at ∂Ts /∂z < -10 K/km. This can be explained by turbulence generating and mixing in convectively unstable regions, which prevent developing of super-adiabatic temperature gradients. In HS regions one may expect larger contribution of nonlinear cascade energy transfer providing increased intensities of small-scale temperature perturbations there (see Table 2).
Analysis shows that positive ∂Ts /∂z are not restricted and their histograms have long tails, especially in HS regions. Table 2 shows that numbers of ∂Ts /∂z > 10 K/km substantially increase in HS layers. Large temperature gradients may form temperature gradient sheets with thickness of several meters producing substantial inhomogeneities of atmospheric refraction index and radio wave reflection during radar observations.
5. Analysis of the MU Radar and Ozonesonde Data
To estimate turbulent vertical ozone fluxes in the tropo-stratosphere, Gavrilov et al. (2004) used the data of simultaneous measurements of turbulence by the MU radar and ozone concentrations by ozonesondes in Shigaraki, Japan, on April 16 - 24, 1998. The MU radar made measurements of Doppler velocity in 5 directions (one vertical and four inclined 10º from zenith) with spatial and time resolutions of 150 m and 2 min, respectively. During the measurements, 21 ozonesondes were launched, providing temperature and ozone concentration with a vertical resolution of 50 m.
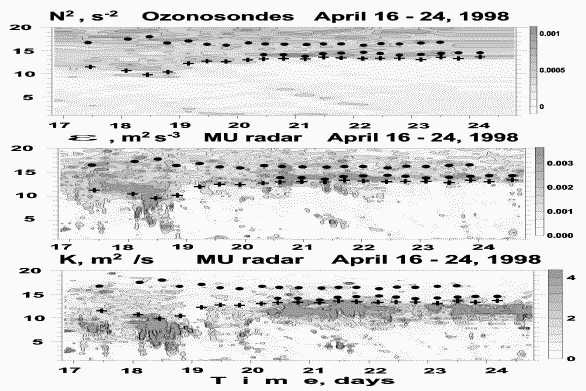
Variance of Doppler velocity, σ2, allows to estimate turbulent diffusivity, K. Vertical gradients of temperature and ozone concentration are estimated by least-square approximation of profiles provided by the ozonesonde in vertical segments of 200 m in thickness (see Gavrilov et al., 2004). Distribution of N2 in top Fig. 3 shows an increase above 10 - 13 km corresponding to the tropopause. Turbulent σ2 and K in Fig. 3 have their maxima at altitudes 8 - 14 km, i.e. near and above the tropopause. Instabilities of the jet stream and increase of amplitudes and instability of gravity waves propagating from below due to sharp increase in N2 above the tropopause [see Gavrilov and Fukao, 2004] may produce increases in turbulent activity above the tropopause.

Figure 3. Height-time variation of Brunt-Vaïssälä frequency (top), turbulent Doppler velocity variance (middle) and turbulent diffusivity (bottom) during simultaneous MU radar and ozonesonde measurements in Shigaraki (see Gavrilov et al., 2004). Dots and crosses denote cold point and temperature gradient tropopauses, respectively.
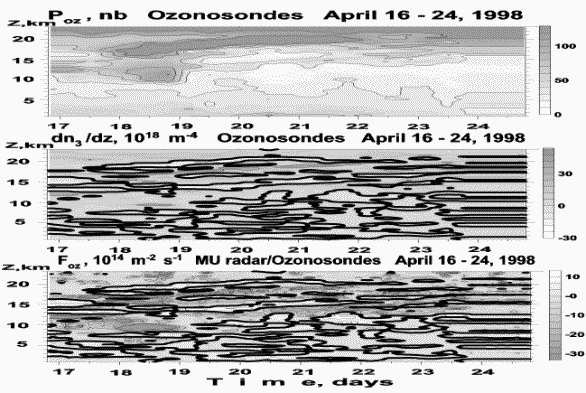
Distribution of ozone partial pressure in top Fig. 4 shows existence of increased ozone concentrations at altitudes 8 - 20 km. This increase above 15 km may be connected with ozone lamina advected by atmospheric circulation (Tomikawa et al., 2002). Inhomogeneous ozone distributions produce vertical gradients of ozone concentration leading to vertical turbulent ozone fluxes shown in Figure 4. A global average downward ozone flux from the stratosphere needed for tropospheric ozone budget is estimated to be of (4-8) X1014 m-2s-1 [e.g. Crutzen, 1988]. Local downward turbulent ozone fluxes in Figure 3 may become the same order of magnitude or even larger than these values.

Figure 4. Same as Figure 3, but for ozone partial pressure (top), vertical gradient of ozone concentration and vertical turbulent ozone flux (bottom). Thick lines show zero value contours.
6. Conclusion
MST radar and high-resolution balloon measurements show possible increase of large-scale, mesoscale and small-scale temperature perturbations in the regions of increased large-scale and mesoscale stability. This may be connected with increasing of amplitudes of atmospheric waves of different scales, their instability and nonlinear cascade energy transfer to motions of smaller scales. Increased turbulence may provide vertical ozone fluxes from the stratosphere to the troposphere, which may have the same orders of magnitude as ozone transport by atmospheric circulation. Vertical and time structures of different local turbulent characteristics and ozone fluxes are very complicated (see Fig. 1 - 4). Further studies of diffusion of minor gas species by intermittent turbulence are required.
Acknowledgements. This study was partly supported by Russian Basic Research Foundation. The MU radar belongs to the Research Institute for Sustainable Humanosphere, Kyoto University, Japan.
References
- Crutzen, P. J., Tropospheric ozone, In I.S.A Isaken (ed.), Tropospheric Ozone, D. Reidel Publ. Co, Dordrecht, 3-32, 1988.
- Gavrilov N. M., Fukao S. Numerical Simulation of Possible Enhancing of Gravity Wave and Turbulent Diffusion of Ozone Near the Tropopause, Proc. XX Quadrennial Ozone Symp., Kos, Greece, June 1-8, 2004, v.2, p.748-749, 2004.
- Gavrilov N. M., Fukao, S., Hashiguchi, H., Kita, K., Sato, K., Tomikawa, Y. and Fujiwara, M.: Study of Atmospheric Ozone and Turbulence From Combined MU Radar and Ozonesonde Measurements in Shigaraki, Japan, Proc. XX Quadrennial Ozone Symp., Kos, Greece, June 1-8, 2004, v.1, 41-42, 2004.
- Lamarque, J. F., Hess, P., Stratosphere-troposphere exchange, Local process In Encyclopedia of atmospheric sciences, Ed. by J. R. Holton, J. A. Curry and J. A. Pyle, Acad. Press, vol. 5, 2143 –2150, 2002
- Tomikawa, Y., K. Sato, K. Kita, M. Fujiwara, M. Yamamori, and T. Sano, Formation of an ozone lamina due to different advection revealed by intensive observations,, J. Geophys. Res., 107, 4092, doi: 10.1029/2001JD000386, 2002
- Pavelin, E., Whiteway, J., Busen, R. and Hacker, J. Airborne observations of turbulence, mixing and gravity waves in the tropopause region:, J. Geophys. Res., 107(D10), 4084, doi:10.1029/2001JD000775, 2002.
- Whiteway, J. A., Pavelin, E. G., Busen, R., Hacker, J., and Vosper, S. Airborn measurements of gravity wave breaking at the tropopause, Geophys. Res. Lett., 30(20), doi: 10.1029/2003GL018207, 2003.
 |
||
| Scientists' Contributions | ||