
 |
||
| Scientists' Contributions | ||
PM10 AND PM2.5 LEVELS IN URBAN PART OF ZAGREB, CROATIA:
SELF-CONSTRUCTED VS. REFERENCE SAMPLERS
Ivan Bešlic1, Krešimir Šega1 and Zvjezdana Bencetic Klaic2
1Institute for Medical Research and Occupational Health, Zagreb
2Geophysical Institute, Faculty of Science, Zagreb
INTRODUCTION
Airborne particulate matter (PM) gives rise to concern as a result of its well established adverse effects of human health (D’Amato et al., 2001; Fisher et al., 2004; Stedman, 2004). A number of epidemiological studies have demonstrated that not all particles are equal with the respect to health effects (for example, Schwartz et al., 1996, Englert 2004). These findings have led to the introduction of size specific particulate mass concentrations, where PM10 and PM2.5 correspond to thoracic and alveolar particles (aerodynamic diameter < 10 µm and < 2.5 µm, respectively). Thoracic particles pose a health concern because they can be inhaled into and accumulate in the respiratory system. Due to their small size, PM2.5 (often referred to as ‘fine particles’) can lodge deeply into the lungs and they are believed to pose the largest health risks. In the light of above epidemiological studies, in 1997 the European Commission (EC) has included PM10 limit values in the new air quality directive in order to protect a human health (http://www.ess.co.at/AIRWARE/REGULATIONS/9662press.html). The new EC Directive establishes an annual daily limit of 20 µg m-3, and a 24 h limit value of 50 µg m-3, which cannot be exceeded more than 25 (from 1 January 2005) and 7 days per year (from 1 January 2010), respectively. However, according to the most recent World Health Organization (WHO) Air Quality Guidelines for Europe (WHO, 2000, also available at http://www.euro.who.int/document/e71922.pdf), current knowledge on the both short- and long-term exposure to PM10 and PM2.5 does not allow the derivation of a threshold below which no negative effects on health occur. This does not imply that no threshold exists but that epidemiological studies are unable to define such a threshold precisely, if it exists. Therefore, an attempt has been made to provide exposure-response relationships based on epidemiological studies of the effects of PM on health. WHO emphasizes that when developing standards, regulators should take into account the degree of uncertainty about these relationships. Namely, differences in the population structure, climate and geography can have an impact on the prevalence, frequency and severity of effects, which may require the modification of the exposure-response relationships provided in the guidelines. On the other hand, in the United States air quality standards distinguish PM2.5 from PM10 since 1997(http://www.epa.gov/air/criteria.html). Thus, annual and 24-hour limit values for PM10, which are set by Environmental Protection Agency (US-EPA), are 50 and 150 µg m-3, respectively, where the latter is not to be exceeded more than once per year. Corresponding figures for PM2.5 are 15 µg m-3 (annual) and 65 µg m-3 (24-hour).
So far, Croatian legislation prescribes recommended (RV) and limit values (LV) and corresponding 98th percentiles for 24-hour sampling time only for total suspended particulate matter (TPM) (Ordinance, 1996). The air is considered as clean or slightly polluted if concentration of TPM is less than RV. Concentrations within the range from RV to LV correspond to moderately polluted air, while values above LV indicate excessive pollution. Annual daily mean and 24-hour mean RV values for TPM are 75 µg m-3 and 120 µg m-3, respectively. Corresponding numbers for LV are 150 µg m-3 and 350 µg m-3. Simultaneously, prescribed 98th percentiles for 24-hour RV and LV are RV 98 = 120 µg m-3, LV98 = 350 µg m-3. This means that annual daily mean TPM concentration for clean or slightly polluted air, for example, must be below 75 µg m-3, and, only up to 2% of days (which is about up to 7 days per year) may have 24-hour mean above 120 µg m-3. At the moment, a new version of Croatian Law on Air Protection is in the phase of elaboration, with an aim to fully harmonize with European Community legislation, which, compared to Croatian strategy has a clear advantage of fixed time framework (Barbalic and Marijan, 2003).
PM is a complex mixture emitted by many sources. Urban PM originates from local mobile and stationary sources, from the resuspended PM from street surfaces, and from larger scales (regional and long-range) transport processes. Additionally, particles are also formed via gas-to particle conversion processes of gaseous precursors, such as sulfur dioxide, nitrogen oxides, ammonia, and volatile organic compounds. Simultaneously, they are submitted to various physical and chemical depletion processes, such as chemical transformation, dry and wet deposition. Apart from investigating PM size distribution and/or chemical composition (e.g. Harrison et al., 2003; Sturm et al., 2003; Martuzevicius et al., 2004) various recent studies focus on identification of PM sources and estimation of sources contributions (Querol et al., 2001; Tsapakis et al., 2002; Kim et al., 2003). Further, since local vehicular traffic is responsible for a substantial fraction of the urban PM, numerous studies address particularly to traffic emissions and/or mobile source contribution to the observed particle levels (Gertler et al., 2000; Buron et al., 2004), and, specifically, to emission factors, i.e. amounts of species emitted per vehicle km driven or per volume of fuel consumed (Sternbeck, 2002; Hausberger et al., 2003; Kristensson et al., 2004).
In Croatia, PM concentrations have been measured regularly on daily basis only in Zagreb since 1972. However, these measurements comprise solely TPM (e.g. Hršak et al., 2001). Therefore, in order to establish a monitoring network for separate PM10 and PM2.5 particle fractions, sampling equipment aiming to satisfy European Norm EN 12341, is designed and manufactured at the Institute for Medical Research and Occupational Health in Zagreb (IMROH). Here, we compare PM10 and PM2.5 concentrations obtained by selfconstructed (IMI) and reference (REF) sampling equipment based on 3-year measurement in residential part of Zagreb. The aim of this study is twofold – to test the suitability of IMI equipment regarding the EN 12341 standard, and, to get insight into urban pollution levels for particle fractions separately.
SAMPLING AND INSTRUMENTATION
Daily samples were collected during the period 1 August 1999 - 31 July 2002 by means of inertial impaction method. Measuring site was situated in residential part of Zagreb, a few kilometers north of city centre, at the location of IMROH (Fig. 1). Two samplers, selfconstructed (Figs. 2 - 4) and reference (Fig. 5) were placed approximately 20 m and 30 m far from the closest one-story building and a road with the moderate traffic, respectively. Reference Low Volume Sampler LVS3, which satisfies EN 12341 norm, was manufactured by Ingenieurburo Sven Leckel, Berlin, Germany. Technical data for both IMI and REF equipment are listed in Table 1. In total, 823 samples were collected per each fraction and sampler.
Fig. 1. Greater Zagreb area. The circle indicates the location of the Institute for Medical Research and Occupational Health (IMROH) where measurements were performed
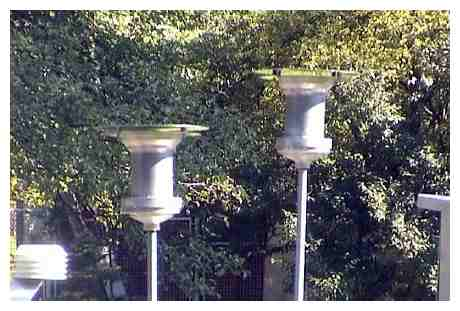
Fig. 2. Inlets of self-constructed (IMI) samplers for PM10 and PM2.5 respectively.
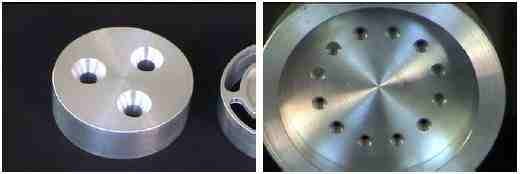
Fig. 3. Nozzles of IMI samplers for PM10 (inlet, left) and PM2.5 (outlet, right), respectively.
Table 1. Technical data for self-constructed (IMI) and reference equipment (REF).
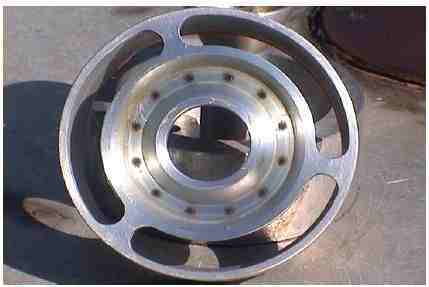
Fig. 4. Impaction plate of IMI sampler for PM2.5. Dark ‘stains’ are larger particles which are separated from the sample. Fine particles were transported by the airflow, and, eventually collected on the filter.
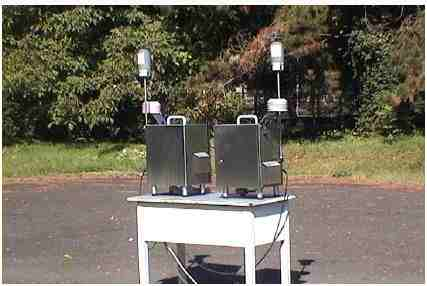
Fig. 5. Reference samplers (REF) for PM10 and PM2.5 respectively.
RESULTS AND CONCLUSIONS
Fig. 6 shows scatterplots of PM10 and PM2.5 concentrations obtained by reference and self-constructed sampling equipment for 3 years period, where corresponding correlation coefficients are 0.671 (PM10) and 0.605 (PM2.5). Though correlations are weaker than required, they exhibit high level of significance (p < 0.01). Further, for both fractions about 40% of concentration pairs departure from the line y = x by more than ± 10 µg m-3.
Nevertheless, as shown in Table 2, parameters necessary for assessment of the air quality agree reasonably well for both fractions.
Fig. 6. REF (absscisa) vs. IMI (ordinate) concentrations (µg m-3) of PM10 and PM2.5 (left and right, respectively) at residential location in Zagreb for the period 1 August 1999 – 31 July 2002. Thick line shows regression line, while thin lines show the departure from a line y = x by ą10 µg m-3.
Table 2. Summary PM10 and PM2.5 concentrations measured by self-constructed (IMI) and reference equipment (REF) during the period 1 August 1999 – 31 July 2002. In total 823 samples per each fraction and equipment were collected.
Fig. 7. Concentrations distributions for PM10 and PM2.5 fractions measured by selfconstructed (IMI) and reference equipment (IMI) at residential location in Zagreb during the period 1 August 1999 – 31 July 2002
Fig. 7 shows concentrations distributions for both fractions for reference and selfconstructed equipment. Consistence of the self-constructed equipment is further confirmed by the fact that concentrations of PM10 are higher than concentrations of PM2.5. However, IMI concentrations for both fractions are generally higher compared to REF concentrations. We believe that there are two possible causes of these discrepancies. One is the error in determination of the air flow rate. Therefore, in order to improve self-constructed equipment, a more accurate gauge lines for flow rate determination should be constructed. The other is a higher efficiency of particle collection by means of IMI sampler, which is a consequence of a larger inlet. The latter, together with the lower sensitivity to ambient wind speed was confirmed by measurements for windy days (not shown here).
As illustrated in Fig. 7, quartile range (25% - 75%) is higher for IMI instrument for both fractions. This may be attributed to different filters used (Table 1). Since membrane filters are highly hygroscopic, the accuracy of concentrations determined by gravimetric method may be affected. Accordingly, in future comparison glass-fiber filters should be used in both IMI and REF equipment.
For both fractions and both samplers concentrations are lognormally distributed, which is in accordance with findings for total suspended particulate matter (Šega and Fugaš, 1982). Here we show frequency distributions only for PM10 for the period 1 August 1999 - 31 July 2000 (Fig. 8).
Above results suggest that self-constructed equipment does not fully satisfy all prescribed requirements. Nevertheless, statistical parameters, which are commonly used in assessment of the air quality, do not significantly differ from those obtained by means of reference equipment. Therefore, IMI samplers, which are available with lower expenses compared to reference equipment, may be satisfactorily used for the air quality monitoring purposes. The more so, their performance may be improved regarding the accuracy of determination of the flow rate and regarding the selection of filters. Finally, during the investigated period both annual daily mean and 24-hour mean concentrations of PM10 recorded in residential part of Zagreb exceeded new EC Directive limit values which should be met by 1 January 2005. Annual daily mean at investigated location was about two times higher than EC limit value, while maximum 24-hour mean was even more than four times higher. Further, 24-hour mean higher than limit value of 50 µg m-3 occurred much more often than recommended by new EC Directive.
REFERENCES
- Barbalic, N., Marijan, G., 2003: New EU versus Croatian air quality standards. Proceedings of the 14th International Conference on Air Quality - Assesment and Policy at Local, Regional and Global Scales, Dubrovnik, Croatia, 6-10 October 2003, 649-659.
- Buron, J. M., Lopez, J. M., Aparicio, F., Martin, M. A., Garcia, A., 2004: Estimation of road transportation emissions in Spain from 1988 to 1999 using COPERT III program. Atmos. Environ., 38, 715-724.
- D’Amato, G., Liccardi, G., D’Amato, M., Cazzola, M., 2001: The role of outdoor air pollution and climatic changes on the rising trends in respiratory allergy. Respir. Med., 95, 606-611.
- Englert, N., 2004: Fine particles and human health - a review of epidemiological studies. Toxicol. Lett. (in press).
- Fisher, P. H., Brunekreef, B., Lebret, E., 2004: Air pollution related deaths during the 2003 heat wave in the Netherlands. Atmos. Environ., 38, 1083-1085.
- Gertler, A. W., Gillies, J. A., Pierson, W. R., 2000: An assessment of the mobile source contribution to PM10 and PM2.5 in the United States. Water Air Soil Pollut., 123, 203-214.
- Harrison, R. M., Jones, A. M., Lawrence, R. G., 2003: A pragmatic mass closure model for airborne particulate matter at urban background and roadside sites. Atmos. Environ., 37, 4927-4933.
- Hausberger, S., Rodler, J., Strum P., Rexeis, M., 2003: Emission factors for heavy-duty vehicles and validation by tunnel measurements. Atmos. Environ., 37, 5237-5245.
- Hršak, J., Šišovic, A., Škrbec, A., Šega, K., 2001: Seasonal differences in the levels of suspended particulate matter and heavy metals in the vicinity of a waste dump. Atmos. Environ., 35, 3543-3546.
- Kim, E., Larson, T. V., Hopke, P. K., Slaughter, C. Sheppard, L. E., Claiborn, C., 2003: Source identification of PM2.5 in an arid Northwest U.S. City by positive matrix factorization. Atmos. Res., 66, 291-305.
- Kristensson, A., Johansson, C., Westerholm, R., Swietlicki, E., Gidhagen, L., Wideqvist U., Vesely, V., 2004: Real-word traffic emission factors of gases and particles measured in a road tunnel in Stockholm, Sweden. Atmos. Environ., 38, 657-673.
- Martuzevicius, D., Grinshpun, S. A., Reponen, T., Gorny, R. L., Shukla, R., Lockey, J., Hu, S., McDonald, R., Biswas, P., Kliucininkas, L., LeMasters, G., 2004: Spatial and temporal variations of PM2.5 concentration and composition throughout an urban area with high freeway density - the Greater Cincinnati study. Atmos. Environ., 38, 1091-1105.
- Ordinance, 1996: Ordinance on air quality recommended and limit values. NN/101, (in Croatian).
- Querol, X., Alastuey, A., Rodriguez, S., Plana, F., Ruiz, C. R., Cots, N., Massague, G., Puig, O., 2001: PM10 and PM2.5 source apportionment in the Barcelona Metropolitan area, Catalonia, Spain. Atmos. Environ., 35, 6407-6419.
- Schwartz, J., Dockery, D. W., Neas, L. M., 1996: Is daily mortality associated specifically with fine particles? J. Air Waste Manage., 46, 927-939.
- Stedman, J. R., 2004: The predicted number of air pollution related deaths in the UK during the August 2003 heatwave. Atmos. Environ., 38, 1087-1090.
- Sternbeck, J., Sjodin, A., Andreasson, K., 2002: Metal emissions from road traffic and the influence of resuspension-results from two tunnel studies. Atmos. Environ., 36, 4735-4744.
- Sturm, P. J., Baltensperger, U., Bacher, M., Lechner, B., Hausberger, S., Heiden, B., Imhof, D., Weingartner, E., Prevot, A. S. H., Kurtenbach, R., Weisen, P., 2003: Roadside measurements of particulate matter size distribution. Atmos. Environ., 37, 5273-5281.
- Šega, K., Fugaš, M., 1982: Personal exposure versus monitoring station data for respirable particles. Environ. Int., 8, 259-263.
- Tsapakis, M., Lagoudaki, E., Stephanou, E. G., Kavouras, I. G., Koutrakis, P., Oyola, P., von Baer, D., 2002: The composition and sources of PM2.5 organic aerosol in two urban areas of Chile. Atmos. Environ., 36, 3851-3863.
- WHO, 2000: Air Quality Guidelines for Europe. Second Edition. WHO, Regional Office for Europe, Copenhagen, 273 pp.
Contact:
Ivan Bešlic, M. Sc.,
Institute for Medical Research and Occupational Health,
Ksaverska cesta 2,
10000 Zagreb,
Croatia,
P.O.B. 291,
e-mail: ibeslic@imi.hr,
(Also available at http://www.euro.who.int/document/e71922.pdf)
 |
||
| Scientists' Contributions | ||