 |
||
| Scientists' Contributions | ||
HUMAN-BIOMETEOROLOGICAL ASSESSMENT OF THE AIR POLLUTION COMPONENT OF THE URBAN CIMATE BY THE INDEX DAQX
Helmut Mayer*, Andreas Matzarakis* and Fritz Kalberlah#
*Meteorological Institute, University of Freiburg (Germany)
#Research and Advisory Institute for Hazardous Substances, Freiburg (Germany)
1. Introduction
The urban climate can be subdivided into different components. With respect to town planning, the thermal component and air pollution component of the urban climate are most important, as they can strongly be influenced by instruments of town planning methods in spatial different scales. Usually, humans are the target group of town planning. Therefore, all results from applied urban climatology which should be considered in town planning have to be assessed in a human-biometeorologically significant way (Mayer, 1993).
For the human-biometeorological assessment of the thermal component of the urban climate, thermal indices, e.g. physiologically equivalent temperature PET (Matzarakis et al., 1999) or OUT_SET* (Spagnolo and de Dear, 2003), can be used. They are based on the human energy balance and represent the thermal perception of humans in a thermophysiologically adequate manner. For the human-biometeorological assessment of the air pollution component of the urban climate, the new index DAQx (Daily Air Quality Index) is available which is briefly discussed in the following chapters.
2. Methodology
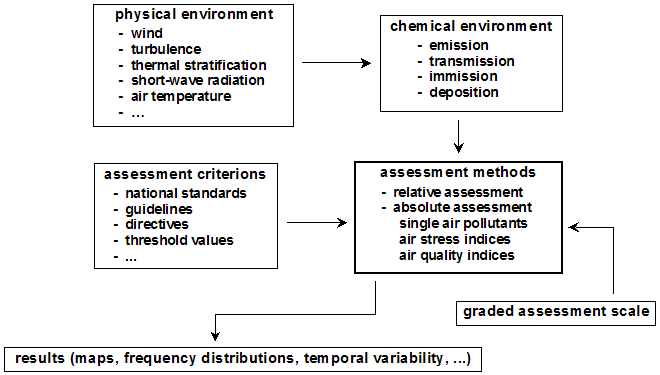
The assessment of the air pollution component of the urban climate can be carried out by different methods (Fig. 1). The normal case is the assessment of single air pollutants. It is based on standards which exist for single air pollutants in almost every country of the world. However, these standards are insufficient in view of the persistent demand, e.g. from town planners, for the assessment of the air pollution which is not limited to a single air pollutant. Therefore, indices for the assessment of the air pollution on the basis of frequently monitored air pollutants were developed. They can be categorized into two groups (Kassomenos et al., 1999, Mayer et al., 2002b). The first group includes indices, which are expressed as the sum of relative concentrations of air pollutants or relative exceedings of threshold values for air pollutants. In Europe, the standards for comparison are EU threshold values. These indices have the disadvantage, that they are only statistical and have no relation to the well-being and health of people. They indicate mainly the content of air pollution in the ambient air and, therefore, are described as air stress indices ASI.
The current air pollution inventory structure for Newcastle is presented in Figure 2 for SO2 and PM10. Emissions from petroleum and coal products dominates the SO2 emissions (65% of 502,000 kg/y), with traffic an important second source (23%) and specialist steel industries an important minor player (9%). Sources of PM10 are more diverse. Emissions from steel processing emit 46% of 768,000 kg/y, followed by traffic (22%), and the chemical industry (16%). Comparison with the sources and emission study for inner Newcastle completed 10 years earlier (Bridgman et al. 1992) suggests that industrial domination of the emissions has waned. In 1992, 96% of the emissions of SO2 occurred from the iron and steel industry. Major sources of TSP were divided into the steel industry, unpaved industrial roads, and open (bare soil) areas. Other sources made up less than 10% of the total TSP load.

Fig. 1. Flow chart for the assessment of the air pollution component of the urban climate

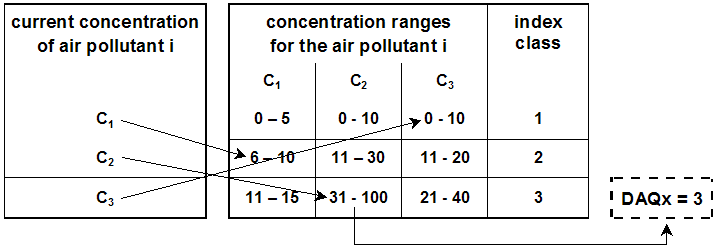
Fig. 2. Scheme for the determination of the impact-related air quality index DAQx (according to Mayer et al., 2002a, b)
Impact-related indices which are called air quality indices AQI constitute the second group. Such indices are very rare, because it is difficult to quantify the impacts of air pollutants on the well-being and health of people. Examples for such indices are the EPA air quality index AQI (EPA, 1999) and the daily air quality index DAQx which was recently developed and tested by the Research and Advisory Institute for Hazardous Substances, Freiburg, Germany, and the Meteorological Institute, University of Freiburg, Germany (Mayer et al., 2002a, b).
The methodology of DAQx is to assign concentrations of ambient air pollutants to different pollutant-specific ranges (Fig. 2). DAQx itself is represented by the highest index class among the considered air pollutants. The relation to the impact on people is given by different classified ranges of air pollutant concentrations, which are derived from epidemiological and toxicological investigations.
Using this method, DAQx is ultimately related to the air pollutant with the highest index class. But for practical purposes, the information on the air pollutant responsible for the DAQx value can be extended by indicating the air pollutant with the second-highest index class. DAQx considers the air pollutants NO2, SO2, CO, O3, and PM10. To enable a linear interpolation between index classes, DAQx is calculated for each air pollutant - according to the EPA index AQI - by:
 | (1) |
with Cinst: daily maximum 1-h concentration of NO2, SO2, and O3, daily highest 8-h running mean concentration of CO and daily mean concentration of PM10; Cup: upper threshold of specific air pollutant concentration range (Table 1); Clow: lower threshold of specific air pollutant concentration range; DAQxup: index value corresponding to Cup; DAQxlow: index value corresponding to Clow.

Table 1. Assignment of ranges of specific air pollutant concentrations to DAQx values and DAQx classes inclusive of classification names (according to Mayer et al., 2002a, b).
3. Results
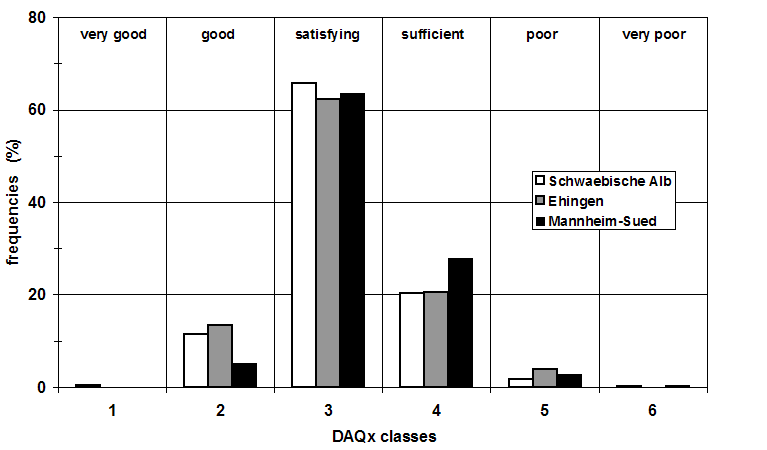
Calculations for DAQx were carried out to investigate the sensitivity of DAQx which are reported in detail by Mayer et al. (2002b). As an exemplary result for the assessment of the air pollution component, frequencies of DAQx classes based on daily DAQx values for a triennial period (1996-1998) are contained in Fig. 3. Air pollution data necessary for the calculation of DAQx originated from three official air pollution monitoring stations in south-west Germany which represent different emission conditions: Schwaebische Alb (far from emissions on a agricultural plateau), Ehingen (mean size city, 24.000 residents, with through roads and Industry), and Mannheim-Sued (larger city, 320.000 residents, with traffic and industry emissions typical of urban conurbations).

Fig. 3. Frequencies of classes of the daily air quality index DAQx at different emission sites in southwest Germany (period 1996-1998)
The results for DAQx do not clearly reflect the qualitative assessment of the air pollution conditions which would be expected by people, i.e. air pollution decreases with increasing distance to emission sources. Ozone which exhibits generally higher values in areas with no anthropogenic emissions is mainly responsible for the slightly unexpected form of the frequencies of the DAQx-classes at the selected sites. To achieve a good clearness, the results of the class-specific DAQx frequencies in Fig. 3 do not provide an indication of the underlying air pollutants, but it is easy to complement the contents of Fig. 3 by the portion which have single air pollutants in each class at the selected sites.
4. Concluding remarks
Different methods have been developed which can be used to assess the air pollution component of the urban climate. Their successful application, however, depends strongly on the available air pollution data. Among the different forms for the results of the assessment of the air pollution component, town planning is most interested in maps showing the human-biometeorologically significant air pollution situation in spatial resolutions which correspond the different planning scales. Such maps can be constructed taking into consideration the method suggested e.g. by Diem and Comrie (2002).
DAQx represents an impact-related index for the assessment of the daily air pollution situation. By use of frequency distributions over a longer period, DAQx results can be used for town planning. But due to its background and the air pollutants considered, DAQx is primarily not suited for the assessment of the long-term air pollution situation within cities. It is possible that a long-term impact-related air quality index considers not the same air pollutants than a daily air quality index. Therefore, another impact-related air quality index has to be developed to assess the long-term air pollution conditions within cities. It should be human-biometeorologically significant and in addition to the assessment of single air pollutants applicable for town planning.
References:
Diem, J.E., Comrie, A.C., 2002: Predictive mapping of air pollution involving sparse spatial observations. Environmental pollution 119, 99-117.
EPA, 1999: Guideline for reporting of daily air quality - air quality index (AQI). United States Environmental Protection Agency, EPA-454/R-99-010.
Kassomenos, P., Skouloudis, A.N., Lykoudis, S., Flocas, H.A., 1999 : Air quality indicators for uniform indexing of atmospheric pollution over large metropolitan areas. Atmospheric Environment 33, 1861-1879. Matzarakis, A., Mayer, H., Iziomon, M.G., 1999: Applications of a universal thermal index: physiologically equivalent temperature. Int. J. Biometeorol. 43, 76-84.
Mayer, H., 1993: Urban bioclimatology. Experientia 49, 957-963.
Mayer, H., Kalberlah, F., Ahrens, D., 2002a: TLQ - an impact-related air quality index obtained on a daily basis. Proc. Fourth Symposium on the Urban Environment, 20-24 May 2002, Norfolk, Virginia, American Meteorological Society, 80-81.
Mayer, H., Kalberlah, F., Ahrens, D., Reuter, U., 2002b: Analysis of indices for the assessment of the air. Gefahrstoffe-Reinhaltung der Luft 62, 177-183 (in German).
Spagnolo, J,. De Dear, R., 2003: A field study of thermal comfort in outdoor and semi-outdoor environments in subtropical Sydney Australia. Building and Environment 38, 721-738.
Contact:
Prof. Dr. Helmut Mayer and PD Dr. Andreas Matzarakis, Meteorological Institute, University of Freiburg, Werderring 10, D-79085 Freiburg, Germany, e-mail: meteo@meteo.uni-freiburg.de
Dr. Fritz Kalberlah, Research and Advisory Institute for Hazardous Substances,
Werderring 18, D-79098 Freiburg, Germany
| Back to the top |
 |
||
| Scientists' Contributions | ||