
 |
||
| Scientists' Contributions | ||
AIR POLLUTION AND METEOROLOGY IN A SMALL CITY: THE CASE STUDY OF NEWCASTLE, NSW, AUSTRALIA
Howard Bridgman and Leanne Graham
School of Environmental and Life Sciences, University of Newcastle
NSW 2308 Australia
Abstract
This paper reviews the recent history of air pollution measurements, and sources and emissions, in Newcastle, New South Wales (NSW), Australia, within its geographical and economic context. Focus is on sulfur dioxide and particulate matter. The meteorology leading to episodes of higher concentrations is incorporated. Generically, this includes a high pressure system over eastern Australia, and dominant regional airflows. The combination of pollutant emissions and meteorology has significant implications for air quality management in Newcastle.
Key words: air pollution, meteorology, management
1. INTRODUCTION
Newcastle, NSW, Australia (Figure 1), is a small city (484 km2) located on the east coast of Australia, with a population of 167,000. It was originally developed with an area of heavy industry (iron and steel making and steel products, non-ferrous metal manufacture, petroleum and coal tar products, and chemicals and fertilizer manufacture) adjacent to the port. The Lower Hunter Region, which surrounds Newcastle, is a semi-rural area and home to 3 coalfired power stations, two aluminum smelters and a lead, zinc, and sulfuric acid smelter. The harbor exports on the order of 70 Mt per year of high quality black coal, as well as agricultural products such as wheat in season. The coal for export arrives by train from open-cut and underground mines in the Upper Hunter region.
Figure 1. Map of Newcastle showing the current location of air quality monitoring and meteorological stations
The local government organization, the Newcastle City Council, has taken a proactive approach toward air pollution problems in the city for several decades. Monitoring for dust fallout and acid gases begin in 1957 and extended to the late 1980s, when more sophisticated equipment was established in six locations in the city (see Figure 1). Current monitoring for air pollution includes sulfur dioxide, nitrogen oxides, particulates of different size ranges, ozone, volatile organic carbons, and carbon monoxide. Supporting meteorological measurements are made at the three EPA monitoring stations and at other locations in the city (Figure 1).
The purpose of this paper is to review the recent history of air pollution measurements, the sources and emissions, the meteorology relevant to air pollution episodes, and to comment on current air pollution management strategies.
2. AIR POLLUTANTS OF MAJOR CONCERN
Historically, the two major pollutants of concern in Newcastle were particulate matter and sulfur dioxide(SO2) (Bridgman et al. 1992; NCC 1998a). The most significant source was industry. Before the mid-1990s, concentrations of total suspended particulate matter (TSP) regularly exceeded the then-current NSW health guideline of 90 g/m3 annual average and 260 g/m3 24-hour average in the inner city. However, major improvements in industrial pollution emissions controls reduced the level of dust fallout to below the NSW guideline of 4 g/m2/mo. Acid gas concentrations (as SO2), significantly high in the early 1980s, fell to within NSW guidelines a decade later with the closure of some industrial sources. In 1999, the largest source of air pollution in the city, the major steel making operations, closed, although specialty steel processing continued.
During the 1990s, Newcastle was a subject for three sources and emissions inventory studies (see Bridgman 2002 for a review). By this time, particulate matter less than 10 m in diameter (PM10) had replaced TSP for health concerns. The National Pollution Inventory (NPI) system is designed to quantify and classify pollutants and their sources in cities and regions around Australia. The results from the NPI provide a foundation for the National Environmental Protection Measures (NEPM) for air, formally activated by the Federal government in 1999 (www.npi.gov.au).
Figure 2. Source apportionment for SO2 (left) and PM10 (right) from the 2002 NPI for Newcastle.
The current air pollution inventory structure for Newcastle is presented in Figure 2 for SO2 and PM10. Emissions from petroleum and coal products dominates the SO2 emissions (65% of 502,000 kg/y), with traffic an important second source (23%) and specialist steel industries an important minor player (9%). Sources of PM10 are more diverse. Emissions from steel processing emit 46% of 768,000 kg/y, followed by traffic (22%), and the chemical industry (16%). Comparison with the sources and emission study for inner Newcastle completed 10 years earlier (Bridgman et al. 1992) suggests that industrial domination of the emissions has waned. In 1992, 96% of the emissions of SO2 occurred from the iron and steel industry. Major sources of TSP were divided into the steel industry, unpaved industrial roads, and open (bare soil) areas. Other sources made up less than 10% of the total TSP load.
Current attention on particulates in Australia is focused on PM2.5 and an associated new NEPM standard. Measurements of PM2.5 have been made in the inner city (Mayfield) over a 10-year period, and for a shorter period at Wallsend (e.g. Huo et al., 1999). Assessment of PM2.5 chemistry (35 inorganic elements) using factor analysis established industry in Mayfield, and traffic in Wallsend as the dominant sources. Figure 3 provides annual trends. Since 1992 the attention given to emissions control mechanisms has had positive effects. The annual average mass of PM2.5 at Mayfield has decreased from a peak of 15 g/m3 in 1994 to about 8 in 2001. The highly significant fall in the soil component began in 1994, and is especially apparent in 2000 after the closure of the major steel works. Similar trends occur for individual elements such as iron and zinc, which represent that heavy industry. Elemental carbon, which represents burning processes, also shows a major overall reduction. The exceptions to this trend are the organic pollutants, which have stabilized around 2 g/m3. These pollutants represent potential future air quality problems in Newcastle, contributing to photochemical pollution events under intense sunlight.
3. RESULTS
3. ATMOSPHERIC CONDITIONS LEADING TO AIR POLLUTION EPISODES Bridgman and McManus (2000) review the overall climate of Newcastle, based on a number of previous studies. Newcastle, at 33oS, is located in the transition zone between the wintertime westerly general circulation regime and the summertime subtropical circulations associated with the high pressure belts. Prevailing winds are northwesterly in the winter, usually associated with katabatic flows down the Hunter River Valley from the surrounding higher elevations. There is a regular incursion of cold fronts associated with low pressure systems to the south, which often bring rain and colder air from the ocean around Antarctica. Temperatures rarely fall below freezing at night and average around 17oC during the day. The ocean is the dominant moderating factor for winter climate conditions. Summertime prevailing winds are southeasterly associated with synoptic high pressure systems, tempered by regular northeast to easterly sea breezes. The onshore flow brings instability and moisture inland, creating local convective and orographic precipitation. Average monthly rainfall during the year maximizes in February. Average daytime temperatures reach 28oC, with maximums occasional reaching the low 40oC range.
Figure 3. Annual average concentrations of PM2.5 mass and the concentrations of elements representing major sources (data courtesy of the Newcastle City Council).
There has been little research that directly relates periods of higher air pollution concentrations in Newcastle to specific meteorological conditions. However, Leighton and Sparke (1995) provide a detailed analysis of synoptic conditions leading to higher air pollution episodes for eastern Australia, especially the Greater Sydney basin. The key synoptic feature is a high pressure ridge which dominates the SE coast of Australia, leading to light and variable winds, strong sunshine, a high frequency of low-level overnight inversions, and pollution recirculation associated with a sea breeze/drainage flow pattern. Local inversions overnight, under prevailing drainage flow conditions, average around 500 m in altitude. These occur on about 65% of the mornings during the year (Bridgman et al. 1992). When this type of synoptic system persists for more than 2 days, elevated concentrations of pollutants can occur, especially in the summertime. Similar synoptic conditions leading to stagnation potential and high air pollution levels have been recognized on a much larger scale in the United States (Wang and Angell 1999).
4. AIR POLLUTION MANAGEMENT IN NEWCASTLE
The Newcastle City Council (NCC) has been a local government leader in applied air pollution management, especially over the past decade. The Newcastle Airshed Management Action Plan (NAMAP) (NCC1998b; Bridgman 2002), was the result of 18 months of work from a consultative committee consisting of representatives from, local and state government, industry, health professions, and the community. Over 230 specific recommendations to reduce air pollution were made to Council in NAMAP. These were ranked as high, medium and low in priority, with recognition that implementation would depend on time, cooperation and resources. The recommendations focused on 11 key issues of concern to the city, listed in Table 1.
Table 1. Key issues in NAMAP (after NCC1998b, Bridgman 2000)
- Minimizing industrial emissions
- Reducing the growth of vehicle kilometers traveled (VKTs)
- Improving energy efficiency
- Managing air quality issues with small and medium enterprises
- Reducing the impact of solid fuel heaters and open fireplaces
- Reducing emissions from industrial premises
- Enhancing air quality management of Council’s own activities
- Making motors run clean
- Monitoring air quality
- Developing better solutions
- Reviewing performance
Of the issues listed in Table 1, most progress has been made in three areas. Council has reduced its energy use, creating a considerable cost savings while reducing greenhouse gases. It has received a grant to change its entire vehicle fleet to biodiesel fuel. As shown in Figures 2 and 3 above, considerable progress has been made in reducing industrial emissions, both in terms of closure of inefficient industries and better quality emissions controls from existing industries. There have been strong attempts to convince residents to minimize the use of solid fuel, especially wood, for heating in the winter. Progress here is slow but steady.
The most difficult area has been reducing the growth of VKTs. The size of the vehicle fleet in Newcastle has been increasing. Political bickering and failure to successfully engage the public have limited the success of policies to provide alternative transport systems. However, traffic represents the major threat for the future quality of Newcastle’s atmosphere, involving a new host of air pollutants, including volatile organics, toxics, and nitrogen oxides. These could produce photochemical smog, due largely to emissions from increasing vehicle use, a feature of many cities around the world.
The photograpgs in Figures 4, 5 and 6 are in pairs showing the same parts of Newcastle in 1978 (up) and in 2003 (down). These photoes are remarcable evidence of the Successful Air Pollution Management of the City Council.
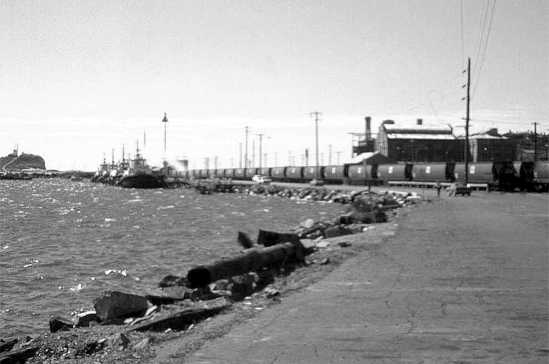
Figure 4.a.
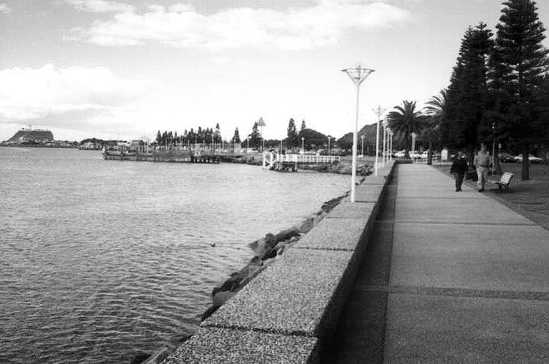
Figure 4.b.
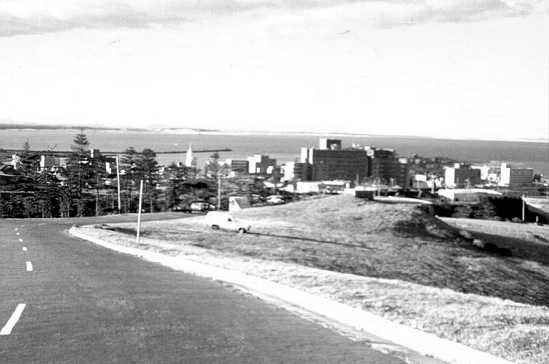
Figure 5.a.

Figure 5.b.
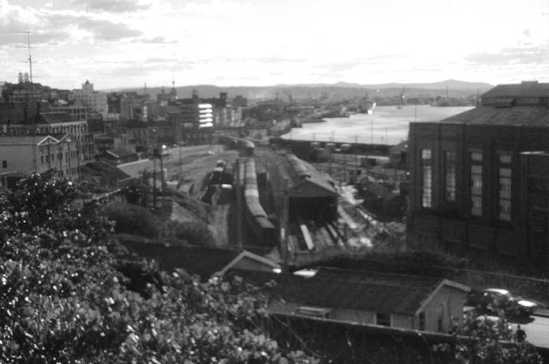
Figure 6.a.
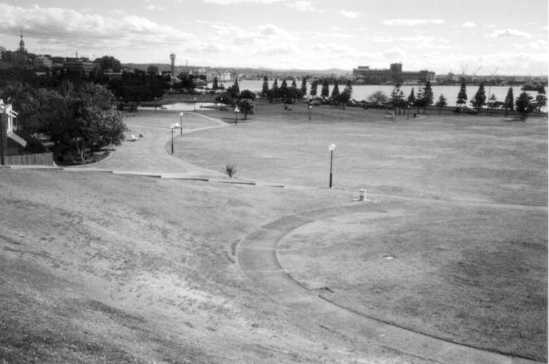
Figure 6.b.
5. CONCLUSIONS
Newcastle, as a medium-sized city in Australia, has made considerable progress on resolving some of its air pollution problems. Major emissions of particulate matter and SO2 from industry have been eliminated, and a more even balance between sources established. The task of further improvements in air quality is more difficult, especially with the additional threat of secondary problems such as photochemical smog. To be successful four major problems must be overcome. The Council, with support from the state government must find better ways of communicating the seriousness of the problem to the community. Cooperation between the public, industry and government must occur for effective strategy implementation. There must be acceptance that some costly infrastructure, such as light rail, is required. Finally, there must be political will power and leadership to make occasionally unpopular decisions to overcome the problem.
6. BIBLIOGRAPHY
Bridgman, H.A., 2000, Air pollution management in Australia: the example of Newcastle, NSW, in Air Quality Management, eds. J. Longhurst and D. Elsom, Advances in Air Pollution Series, Computational Mechanics Publications, Southampton, pp. 159-195.
Bridgman, H., Manins, P., and Whitelock, B., 1992, An Assessment of the Cumulative Emissions of Air Pollution from Kooragang Island and the Inner Suburbs of Newcastle, report to the NSW Department of State Development, University of Newcastle Research Associates, 162 pp.
Bridgman, H. and McManus, P., 2000, Weather, Climate and Air Quality: The Hunter’s Atmosphere, in Journeys, the Making of the Hunter Region, eds P. McManus, P. O’Neill, and R. Loughran, Allen and Unwin, Sydney, pp 42.66.
Huo, X., Crisp, P., and Cohen, D., 1999, Source apportionment of fine particles in the Wollongong-Port Kembla area during 1992 & 1993, Clean Air and Environmental Qulaity, 33:26-35.
Leighton, R.M., Sparke, E., (1995) Relationship between synoptic climatology and pollution events in Sydney, Technical Report 68, Bureau of Meteorology, Melbourne, Australia
NCC, 1998a, Air Quality Summary Paper, Newcastle City Council, Newcastle.
NCC, 1998b, Newcastle Airshed Action Management Plan, Newcastle City Council, Newcastle.
Wang, J. and Angell, J., 1999, Air Stagnation Climatology for the United States (1948-1998), NOAA/Air Resources laboratory ATLAS No. 1, United States Department of Commerce, Maryland, 73 pp.
Contact:
A/Prof Howard A. Bridgman
Coordinator, Postgraduate Environmental Program
School of Environmental and Life Sciences
University of Newcastle
2308 NSW Australia
Telephone : 61- (0)2 - 4921 -5093
Facsimile: 61 - (0)2 - 4921-5877
E-mail: Howard.Bridgman@newcastle.edu.au
Related Internet site to visit is that of the “Clean Air Society of Australia & New Zealand” (CASANZ): http://www.casanz.org.au
| Back to the top |
 |
||
| Scientists' Contributions | ||