
 |
||
| Scientists' Contributions | ||
SOME BIOMETEOROLOGICAL ASPECTS OF URBAN CLIMATE IN SOFIA
A.Tzenkova*, I. Kandjov** and J. Ivancheva*
* National Institute of Meteorology and Hydrology, Sofia, Bulgaria,
** National Center of Physical Therapy and Rehabilitation, Sofia, Bulgaria
Abstract
The urban climate has different components with specific dynamics in the process of growth of the urban structure. In the present paper the regime of the thermal comfort on the basis of the Siple&Passel cooling power index and the Thom temperature-humidity index is analyzed. For this purpose daily data for the air temperature and humidity, and wind speed from 2 meteorological stations in Sofia for the period of their existence has been used. The observed differences in the level of the thermal comfort between the both stations were caused by the differences in the dynamics of urbanization in their environment
Key words: urban climate, bio-climatic indices, human body thermal comfort
1. INTRODUCTION
The change of one of the basic abiotic factors of the urban ecosystem - the climate, as a result of the city development process influences the level of the human thermal comfort. A number of indices and parameters are used to express the impact of climate conditions on the human beings. The overgrowth of the Bulgarian capital Sofia and the increase of its urbanization cause a change of the microclimate and leads to variations of the human comfort conditions.
2. METHODS AND DATA
The aim of the present investigation is to analyze the human comfort conditions in Sofia under urbanization process using data from two meteorological stations.
The Botanic Garden (BG) station (in operation from 1906 until 1991) is situated in the center of the city and the density of the urbanization of the surrounding area has not drastically changed during the last fifty years. The daily data for the air temperature, relative humidity and wind speed (7h, 14h and 21h) for the period 1906-1990 has been used.
The HMS (HMS) station (still in operation), placed in the National Institute of Meteorology and Hydrology was founded in 1952 as a rural one. At present an approximately dense urbanized area surrounds it. The daily data (7h, 14h and 21h) for the period 1952-1999 are used. For the purpose of the study we chose two biometeorological indices: cooling power index K of Siple&Passel, and Thom’s discomfort index DI.
The results of authors' previous studies reveal that K is suitable for two reasons: air temperature and wind velocity are some of the considerable influenced meteorological parameters by urbanization; the formula is suitable for the calculation of long data series as well. The index K (in W/m2) is calculated following the formula [1]:

where v is wind velocity in m/s, and t is air temperature in °C°.
The classification of the Siple and Passel index K [2] is given in Table 1.
Table 1. Classification of K modified from Besancenot:

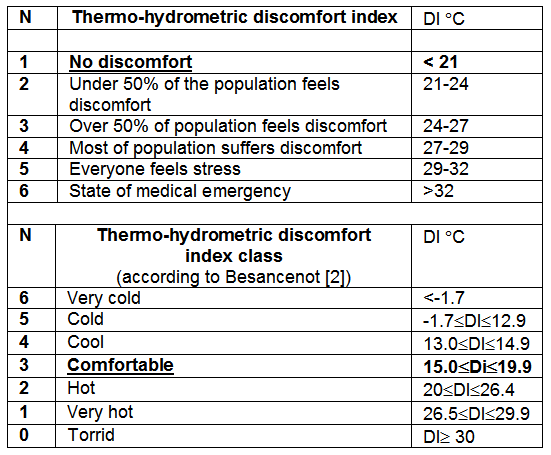
There are many ways of representing the effective temperature (the temperature of a still atmosphere which will lead to the same thermal sensation as that of existing combination of temperature and humidity). The discomfort index of Thom DI produce values very close to the effective temperature for a range of temperatures and related humidity. The formulae used in the article for calculation of DI [2]is:

where T is temperature in °C and RH - relative humidity of the air. The other advantage of the formula is that it provides simple approach to use in readily available data. The Thom’s discomfort index Di is distributed according to the schemes given in Table 2.
Table 2. Classification of DI:
3. RESULTS
The results show that the human thermal comfort conditions in spring and autumn in Sofia are almost comfortable. That is why we will present the results for the representative months for the summer and winter seasons respectively – July and January.
3.1. Siple and Passel Cooling Power Index Ê
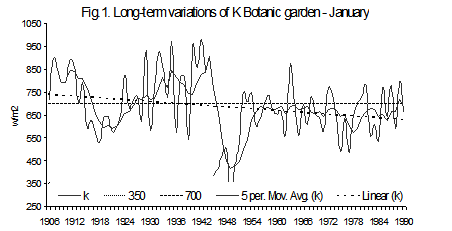
As can be seen on Fig.1 and 2 in both stations in January a tendency of change in the comfort conditions is observed. In the Sofia center (the BG station) up until 1950 the mean K values are in a direction of human sensations such as keen, cold and very cold. Then, up to the end of the observation period, the values remain in the range of comfort; the sensations are for a cool or comfortable climate. The mean value of K for the period 1961-1990 is within the comfortable class. This is a result of the process of city growth and its influence on the wind and air temperature regime, leading to the formation of favourable biometeorological conditions in winter in the urbanized areas.
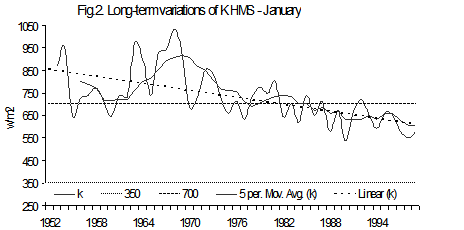
In the eastern periphery of Sofia (HMS), while it was not yet entirely built-up (around 1970-1972), the character of the climatic conditions is near to the rural conditions (Fig. 2). With the completion of the building process in this region of Sofia the average winter conditions have a tendency for warmer human sensations in the range of comfort.
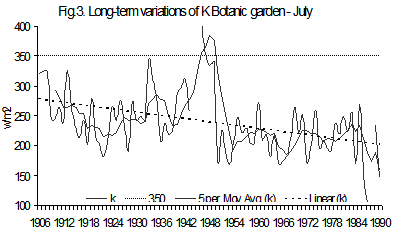
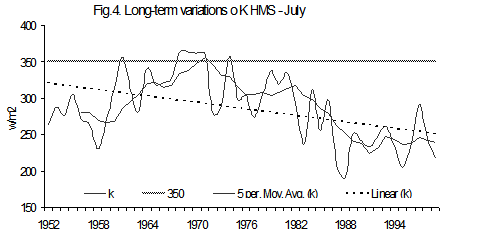
The unfavorable influence of the increasing of the urbanization level in Sofia during the warm period of the year on the character of the human comfort sensation is shown on Fig.3 and Fig.4. In both stations July values are out of the comfort zones. According to the BG station data after 1950 the K values vary around 200W/m2, showing a formation of hot subcomfort. In the last two years of the period there are K values characterizing the summer conditions as uncomfortable. The overheating influence of the city environment in summer is well expressed in the area of HMS station, where in separate years after 1986 the summer conditions can be labeled as hot discomfort (K<174W/m2).
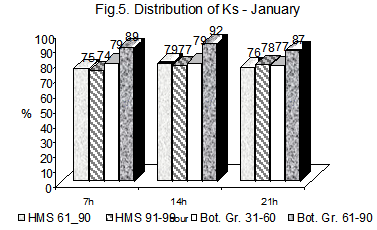
The daily course of the biocomfort conditions is analyzed based on the frequencies of K classes for 07:00, 14:00 and 21:00 for different periods. For station BG the 1931—1960 and 1961-1990 periods were investigated, for the HMS station the periods were 1961-1990 and 1991—1999.
For a more generalized analysis of the weather conditions that can be accepted as close to comfortable, a frequency of the sum of classes 2, 3 and 4 (Ks) were used – Fig.5 and Fig.6. For the two periods in January at the BG station an increase of frequency of Ks is observed. This tendency is better expressed at 14:00 – from 79% during 1931-1960 up to 92% for 1961-1990. In morning and in evening the increase is around 10%. In HMS station the winter comfort conditions do not change substantively for the investigated periods.
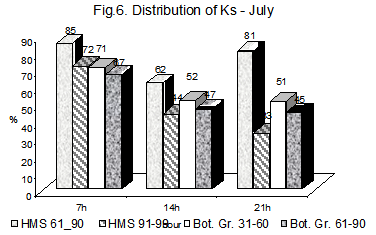
In July HMS station the comfortable and close to comfortable weather conditions prevail. The frequency of Ks is over 80% in morning and evening, and 62% at 14:00 respectively. At the same time in the central city areas (the BG station) the frequency of Ks is lower. This difference is greatest at 21:00, when 51% of cases were close to comfortable. In the Botanical Garden the Ks value is 5% to 10% (at 21:00) less than in the previous period. For the period 1991-1999 in the eastern part of Sofia (HMS) the comfort conditions changed for the worst. This is most strongly expressed at 21:00, when discomfort conditions 77% of the cases were observed.
3.2. Thom’s discomfort index DI
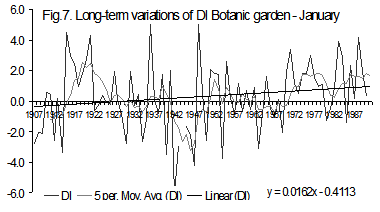
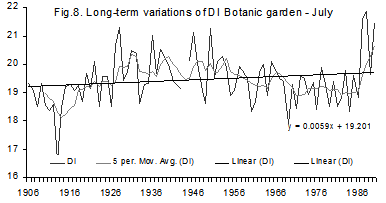
The long-term variations of the Thom’s discomfort index are analyzed using the Botanical Garden station data – Fig.7 and Fig.8. The analysis shows that the tendency of change of DI during years is to the warmer comfort conditions, as well. The tendency is strongly expressed in winter. After 1950 only in particular years the mean January values of DI are under –1,7°Ñ. In summer the monthly DI values are in the range of the comfortable summer conditions; just in separate years July can be classified as hot one.
The distribution of different comfort classes for 07:00, 14:00 and 21:00 for the different periods is calculated. The warming tendency in the central area of city in winter is keeping for all observation terms. In January at 21:00 in the BG station for the 1931-1960 the frequency of the coldest DI class (DI=6 according to the classification of Besancenot) is 37%, and decreases to 27% in the period 1960-1990, respectively. In the same last period in the HMS station the frequency of this class is with 10% greater.
The summer conditions in Sofia investigated through the Thom’s index may be characterized as comfortable or pleasantly cool ones. There is a tendency for a decrease of the cool cases (DI=4) and increase of the comfortable conditions (DI=3).
4. CONCLUSIONS
The presented results reveals a pronounced influence of the level of urbanization on the human sensation of thermal comfort. The used bioclimatic indices of Siple &Passel and Thom described adequately the long-term variability of the urban environment. The Thom’s discomfort index is more adequate for summer conditions, but nevertheless express the general tendencies in changes of human comfort conditions.
The considered classifications are based only on the impact of meteorological conditions, not accounting for air pollution. A more complex classification of the comfort rate taking into account this environmental feature would have been more suitable but, regretfully, we do not know whether such classification is available.
Each index clearly shows that the process of growth of Sofia leads to the shifting of bioclimatic comfort conditions to the warm classes. Both indices provide information, which we feel, will be of use to the city authorities for the future development and urban planning.
ACKNOWLEDGEMENTS
The authors gratefully acknowledge The National Science Fund (Ministry of Education and Science – Republic Bulgaria) for financial support of the Project ÍÇ-905 – Analyses and estimation of climate variability and human comfort in Sofia.
References
- Siple, P.A., Passel, C.F. (1945). Measurements of dry atmospheric cooling in subfreezing temperatures. Proc. Amer. Phil. Soc., 89: 177-99.
- Besancenot, J.P. (1978): Le bioclimat humain de Rio. In: Suchel J.B., E. Altes, J.P. Besancenot, and P. Maheras (Eds.), Recherches de Climatologie en Milieu Tropical et Mediterranean . Cahier No. 6 du Centre de Recherches de Climatologie, Universite de Dijon, Dijon
- Thom, E. C. 1959, The discomfort index, Weatherwise, 12, 57-60
| Back to the top |
 |
||
| Scientists' Contributions | ||