 |
||
| Scientists' Contributions | ||
Some characteristics of air quality parameters in Southern Hungary
Laszlo Makra1, Szilvia Horvath1, Andras Zempleni2, Villo Csiszar2, Katalin Rozsa2* and Gabor Motika3
-
1 Department of Climatology and Landscape
Ecology, University of Szeged,
H-6701 Szeged, P.O.B. 653, Hungary;
2 Department of Probability Theory and Statistics, Eotvos Lorand University,
H-1053 Budapest, Kecskemeti u. 10-12, Hungary
3 Environmental Protection Inspectorate of Lower-Tisza Region,
H-6701 Szeged, P.O.B. 1048, Hungary;
Contact: Laszlo Makra, e-mail: makra@geo.u-szeged.hu
BACKGROUND
Air pollution is one of the most important environmental problems, which concentrates mostly in cities. Generally, human activities induce monotonous accumulation of pollutants. Possible reasons of worsening air quality are population growth in cities and, in connection with this, increasing built-in areas there. A considerable part of population growth is coming from the migration to the cities. The ever-increasing urban population, together with the growing industrialisation and energy consumption and the extensive transportation, raise air pollution, which becomes a more and more serious challenge for the interest of survival. The aim of the study, considering the above-mentioned classification, is complex: namely, to determine partly spatial and temporal characteristics, partly statistical interrelationships of air pollutants and to analyse their connection with meteorological elements.
The database of the study results, on the one hand, from an automatic environmental monitoring station at Szeged downtown, for the period between 1997-1999. This station is located in the downtown, at a busy traffic junction (in the intersection of Kossuth Lajos blvd. and Damjanich street - Terez street), and measures mass concentrations of CO, NO, NO2, SO2, O3 and TSP (total suspended particulate) (mg m-3). Calibration of gas analysers occurs at two points. One of them is the 0-point, which is set automatically, in every 24 hours. Whereas the other calibration point is set once in every second week by a verified sample. Calibration of the O3 instrument is performed by gas phase titration. Verification of TSP measurements occurs once in every quarter of a year. A personal computer serves to perform instrumental control and data storage. Data are produced primarily as one-minute averages from ten-second measurements. Then, thirty-minute averages are determined and stored. Another source of the database is the RIE (Regional Immission Examination) network for Szeged and Csongrad county. From this network, we used monthly mean concentrations of NO2 and SO2, as well as monthly totals of deposited dust (g/m22 / number of days of the month) for the period between 1985-1999.
EXTREME VALUE ANALYSIS
Estimating the joint occurrences of extreme high values for two pollutants is especially challenging. We carried out a step-by-step analysis of the data in order to model first the univariate and then the joint tail behaviour of the pollutants. Here analysis for the pair of CO-NO is presented (analogous results for some other pairs will be shown later). As most of the extreme value analysis methodology is suitable for independent and identically distributed observations, the linear trends and periodic parts from the observations (Fig. 1), (the latter ones were based on daily maxima), were removed as otherwise the high number of usually small values would outweigh the most important larger ones. The data show a natural annual cycle and trends in the residuals can also be observed. We have been able to model it suitably by a linear regression. We concentrate on the dependence of the extremes: i.e. on the observation of high values for both pollutants. Coles et al. (1999) give a review for dependence measures for extreme value analysis and we followed some of their methodology in our investigation. The joint distribution can be modelled by the logistic bivariate extreme value distribution, for which the probability of exceeding high values in both co-ordinates can be given as follows:
 | (1) |
A SPECIAL CASE OF THE TWO-SAMPLE T-TEST
A new statistical test is developed by Makra for determining if there is significant difference between expected values of non-independent time series (Makra et al., 2000a). The developed expression
 | (2) |
is a random variable with N(0;1) distribution, where
 is the expected value of the whole sample with N
elements,
  is that of the share sample with n elements
(the latest sample is part of the earlier one) and
  is the joint standard deviation of the two samples considered (we suppose that
standard deviations of the two samples are the same).
From the table of the distribution function of the standard normal distribution, that xp can be determined to a given p number (0 < p < 1), for which:
 | (3) |
If the absolute value of the above random variable with
N(0;1) distribution is higher than xp, then
it is said that  and
and  differ
significantly. The 0-hypothesis, according to which there is no difference
between
  and
and  , is realised not
more than at the critical p probability. Significance-tests are carried out at
p=0.01 probability level.
MODELLING EXTREME VALUES OF CO AND NO
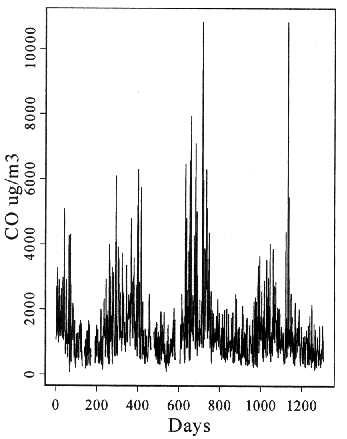
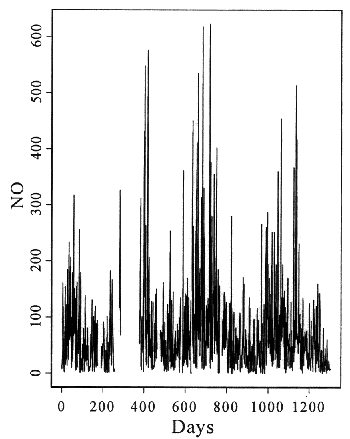
Daily maxima of CO and NO are shown in Fig. 1.
Fig. 1. Daily maxima of CO- and NO concentrations,
measured at the air quality monitoring station, Szeged downtown, for the period
01.01.1997-31.12.1999
The actual analysis was based on the weekly maxima of the
detrended and deperiodised data. The motivation for considering this shorter
time series was twofold. First, we could hope for a better fit to this weekly
maxima by an extreme value distribution, and second, the dependence was also
reduced this way. The dependence between neighbouring days is caused partly by
the slow changes in pollutant levels, and partly by the sustained
meteorological situations, effecting the pollutant levels. This dependence is
reduced when we use weekly maxima only. We need our observations to be maxima
or minima in order to apply the extreme value distributions. The longer periods
we choose, the better fit can be expected. As the relative shortness has not
allowed much more rarefication, we chose the time series of weekly maxima.
We estimated the so-called tail dependence coefficient c,
which gives a natural description of dependence between extreme values as
follows:
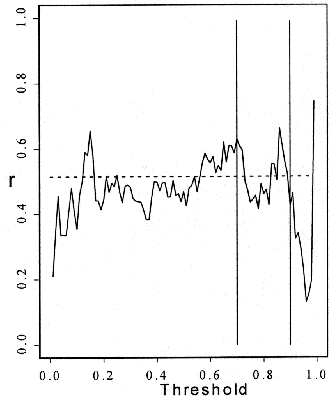
where Fig. 2. Scatter plot of transformed (to uniform in
both variables) data (first graph); the dependence of the estimated value of
ron the threshold (the values between the vertical lines provided the
actual value shown by the dotted line, second graph)
One can see the strong dependence between the co-ordinates.
To estimate the parameter r or c, one has to define thresholds,
where only the observations higher than the given threshold play a role in the
estimator. The curve given in the second part of Fig. 2. shows the different
estimators for r, depending on the threshold. As we are interested in
the dependence for the extremes, we decided to take thresholds between 0.7 and
0.9 into consideration (see the vertical lines; we excluded the thresholds
higher than 0.9 because of the high variation, which is due to the limited
number of observations here). We accepted the average of the values in this
area as our first estimator (r=0.5155; see the dotted horizontal line).
We used two other methods for estimating r, too: maximum likelihood (ML)
and a moment-type estimator. The results are given in Table 1.
Table 1. Comparison of different estimators for the logistic model
One can summarise the results as follows: the difference
among the estimated periods is less than 10%, with the largest value given by
the estimator based on c, which is probably due to the fact that here
only the higher values were taken into consideration, which seems to be
appropriate in our case, where one cannot hope for perfect fit of the extreme
value model (supposed for the ML method).
TEMPORAL VARIABILITY OF AIR POLLUTANTS
Fig. 3. shows the average annual cycles of NO,
NO2, O3 and
Ox at the air quality monitoring station
Szeged, for the period between 1997-1999. Ox,
according to its definition, is the sum of NO2
and O3. Ox
concentration is suitable for estimation oxidating capacity of the atmosphere.
Some wet chemical procedures (with absorbing solution), used earlier for
measuring O3, actually provided
Ox concentration data.
Fig. 3. Average annual cycles of NO,
NO2, O3 and
Ox at the air quality monitoring station,
Szeged downtown, for the period 1997-1999.
The annual cycle of the primary air pollutant NO shows the
greatest values in November, December and January, with its maximum at the end
of January (Fig. 3.). As NO concentration depends not only on emission but on
weather conditions as well, higher winter values refer to atmospheric stability
with frequent inversions. The average annual cycle of NO has the lowest values
in summer, (June and July). This can be explained by quicker oxidation of NO in
summer, but dilution because of intensive vertical exchange in the atmosphere
is more important. The annual cycle of NO2,
which is secondary substance and produced mainly by chemical reactions,
presents similar course to that of NO. Tropospheric ozone is produced by the
action of short-wave radiation on substances emitted from anthropogenic sources.
Consequently, the average annual cycle of O3,
together with that of Ox, has the greatest
values in summer (June and July). The annual cycles of these pollutants show
similar picture to those in Stuttgart, Germany (Mayer, 1999).
The diurnal cycles of NO and
NO2 (Fig. 4.) have the
shape of a double wave, with bigger amplitudes for NO than for
NO2. Due to the traffic density, the
concentration of NO is relatively higher on weekdays, than on weekends. This
effect can also be observed for the secondary substance
NO2. The average diurnal variations on
weekdays are greater for NO than for NO2,
because NO2 has a longer lifespan than the
more reactive NO. Generally, the NO concentrations are higher in the morning,
then in the evening. This can be explained by the fact that in the morning the
rush hour is shorter and the atmosphere near the surface is more stable than in
the evening. The low NO concentrations early in the afternoon result mainly
from the oxidation of NO by O3 and more
intensive vertical exchange (dilution) of the atmosphere. The diurnal cycles of
O3 show a clear daily course with one wave. A
maximum takes place in the early afternoon caused by photochemical
O3 formation, while a minimum occurs after
midnight. On the basis of its definition, the diurnal cycle of
Ox is similar to that of
O3. On weekends, the average
O3 maximum values are a little higher than on
weekdays, but this is not valid for Ox (Fig. 4).
Fig. 4. Average weekly and diurnal cycles of NO,
NO2, O3 and
Ox at the air quality monitoring station,
Szeged downtown, for the period 1997-1999.
As a comparison with the air pollutant characteristics in
Stuttgart (Mayer, 1999), average weekly and diurnal cycles of the pollutants at
Szeged show, on the one hand, less extremities, namely, less amplitudes of the
values; on the other hand, the values themselves are lower at Szeged. At the
same time, secondary extremes at Szeged can be shown only in the diurnal cycles
of NO and NO2 (Fig. 4)
and in their peak values (presenting only for NO) (Fig. 6).
At Szeged, lower extremities and smaller concentrations can be explained by
less traffic. Peak values for NO occur late in the evening, while secondary
maxima are measured in the morning (Fig. 6). Diurnal course
of mean NO2 concentrations shows a similar
double wave (Fig. 4.), whilst that of mean NO-concentration has a
characteristic primary maximum at the beginning of the week (Monday, Tuesday
and Wednesday) (Fig. 4). Maximum values in the diurnal
course for mean O3 concentrations (Fig. 4.)
as well as its peak values (Fig. 5) can be found on
weekends (on Saturdays and Sundays). Peak values of
O3 and NO represent lower concentrations and
less extremities (Fig. 5-6), furthermore, secondary
extremities are less characteristic as those in Stuttgart (Mayer, 1999).
Fig. 5. Average weekly and diurnal cycle of
percentile values of O3 at the air quality
monitoring station, Szeged downtown, for the period between 1997-1999.


(4)
 , corresponds to the
parameter r in (1) as
 =2-2
=2-2 ). Before estimating these quantities, we transformed
the marginals of the weekly maxima into uniform distributions (first plot of
Fig. 2).


r
(CO; NO)
in mkg/m3
Estimator based on 
0.5155
return period in years
Maximum likelihood
0.4608
return period in years
Moment-type
0.4951
return period in years
(6000; 500)
(8000; 600)
(14000; 900)
3.934
9.333
105.061
3.603
9.809
99.460
3.802
10.128
102.740


 |
||
| Scientists' Contributions | ||
