A. 
| B. 
|
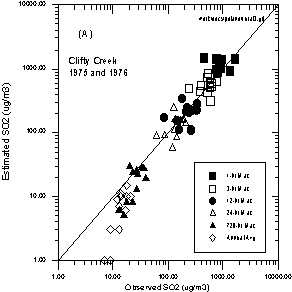
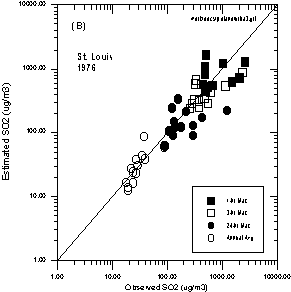
| Figure 8 Comparison of observed and simulated SO2 concentrations for (A) an isolated power plant in a rural area, and (B) for an urban area in central United States. | |
A. 
| B. 
|
| Figure 8 Comparison of observed and simulated SO2 concentrations for (A) an isolated power plant in a rural area, and (B) for an urban area in central United States. | |