A. 
| B. 
|
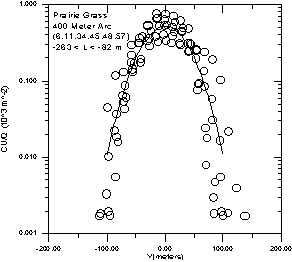
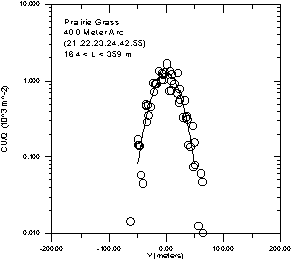
| Figure 5a Near-neutral unstable ensemble normalized concentration values. Experiment numbers are shown within the figure. | Figure 5b Near-neutral stable ensemble normalized concentration values. Experiment numbers are shown within the figure. |