A. 
|
|---|
B. 
|
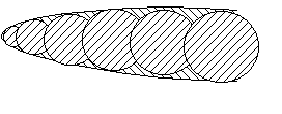
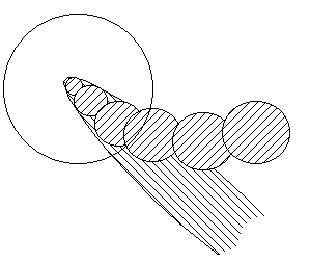
| Figure 4 Illustration of (A) how a plume of material that is dispersing downwnd might be approximated using a series of overlapping puffs, and (B) how a puff model is better able account for the time and space variations in the wind directions. The circle in (B) illustrates that there is a region where the plume and puff models may provide similar results (typically on the order of 10 to 20km in radius). |