 |
||
| Scientists' contributins | ||
A Study of Ozone Critical Levels in Denmark
Over a Ten-year Period
Zahari Zlatev, Gerald Geernaert and Henrik Skov
National Environmental Research Institute (NERI)P.O.Box 358, DK-4000, Denmark
Contents:
- Abstract
- 1. Critical Levels for Ozone
- 2. Exceedances of the first critical level in Denmark during the period 1989-1998
- 3. Exceedances of the second critical level in Denmark during the period 1989-1998
- 4. Effect of using the emissions from Scenario 2010
- 5. Main conclusions
- References
Abstract
Two groups of critical levels for ozone are under discussion in connection of the forthcoming EU Ozone Directive. The first group consists of critical levels, which are harmful for the human health when exceeded. The second group consists of critical levels, which are damaging plants (crops, forest trees, etc.) when exceeded. The critical levels of the first group are related to short exposures of humans to high ozone concentrations (the effects being measured by the number of hours and/or days in which the ozone concentrations were very higher than 90 ppb or 120 ppb). The critical levels of the second group are related to long exposures (three to six months) and the effect is measured by the accumulated exceedance of the critical value of 40 ppb in the considered period. The exceedances of the critical levels in Denmark were studied over a ten-year period (from 1989 to 1998) using the Danish Eulerian Model. Two scenarios were investigated. The first used the actual European emissions for each year in the period under concideration (Basic Scenario). The second used anthropogenic European emissions expected for year 2010 (Scenario 2010). Some of the obtained results are discussed in this paper.
1. Critical Levels for Ozone
Several critical levels for ozone are currently discussed in connection with the forthcoming EU Ozone Directive (see the draft of this directive in European Commission, 1998). Two of the most important critical
- The number of days in a given period (month, season, year, etc.) in which the ozone concentrations are exceeding 120 ppb during at least one hour.
- The exceedance of the limit of 3000 ppb.hours for AOT40C values (AOT40C:
Accumulated over a threshold of 40 ppb ozone concentrations in the daytime
hours in the period May-June-July, see more details in, for example,
Bastrup-Birk et al., 1997).
The first of these two critical levels is considered as harmful for human health when it is exceeded. Moreover, if this level is exceeded or if it is expected that it will be exceeded in the next two-three days, then the situation is to be considered as serious and the population should be warned. Exceedance of the second critical level is harmful for crops, and might cause considerable economic loses; see Dimov et al. (1999).
Calculation of ozone concentrations in Denmark over a ten-year period (1989-1998) has been performed using the Danish Eulerian Model. The model is described in Zlatev (1995). Comparisons of model results with measurements over land have been presented in Zlatev et al. (1992,1993). Comparisons of model results with measurements taken over the sea (the North Sea) have been reported in Harrison et al. (1994). Some other studies using the Danish Eulerian Model have been carried out in Bastrup-Birk et al. (1997) and Zlatev et al. (1996). Finally, many results obtained by this model can be found in the web-site of the model; see WEB-site for the Danish Eulerian Model (1999).
Some results obtained in the computations for the ten-year period from 1989 to 1998, together with results obtained by using the well-know emission scenario for year 2010 (Scenario 2010, see Amann et al., 1999 and EMEP, 1998). The results are used to evaluate the exceedances of the two critical levels in Denmark today and in the future.
2. Exceedances of the first critical level in Denmark during the period 1989-1998
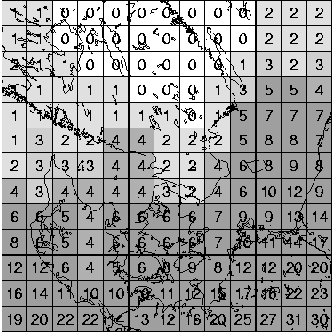
The model results, which were obtained by running the Danish Eulerian Model over the ten-year period 1989-1998, indicate that the situation in which the critical level of 120 ppb has been exceeded occurs rather seldom in Denmark. However, there are some summer periods in which this happens. Fig. 1 shows the total numbers of days in which the ozone concentrations was over 120 ppb for the different parts of Denmark. It is seen that these numbers vary between 3 and 10.
EXPOSURE TO HIGH OZONE CONCENTRATIONS
Numbers of days in which the ozone is higher than 120ppb.
Accumulated results 1989-1998 (Basic scenario)

Above 4
3-4
2-3
1-2
Below 1Figure 1 Accumulated numbers of days (for the period og ten years with basic scenario), where the ozone concentration was greather than 120ppb in at least one hour
3. Exceedances of the second critical level in Denmark during the period 1989-1998
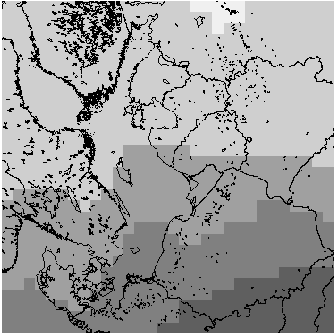
The exceedances of the second critical levels occur much more frequently. The results from our experiments as well as from measurements indicate that (i) exceedances happen every year and (ii) the critical value of 3000 ppb.hours is exceeded by a factor varying between 2 and 5. The AOT40C values have also been averaged over the ten-year period in order to avoid the influence of the meteorological conditions (very warm summers or very cold summers). The averaged results are shown in Fig.2.
EXPOSURE TO HIGH OZONE CONCENTRATIONS
Percentages: 100*AOT40C/3000
This figure shows the relative changes, in percent, of the AOT40C values in the period 1989-1998 (Basic scenario)

Above 700
600-700
300-500
100-300
Below 100Figure 2 Exceedances of the averaged (over the period of teh years) AOT40C values obtained by using the basic scenario
4. Effect of using the emissions from Scenario 2010
The European emissions in year 2010 are expected to be much less than those in 1989 (see, for example, Amann et al., 1999). This is illustrated in Table 1. It is also seen inTable 1 that the European emissions have already been reduced considerably from 1989 to 1996.
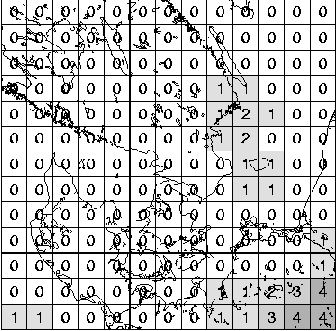
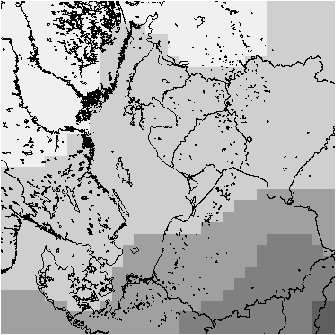
Emissions 1989 1996 2010 SO2 43096 26755 18661 NOx 23752 19843 14980 VOC 22542 17843 13799 NH3 7922 6689 6899 Table 1 The total European anthropogenic emissions in 1989 and 1996 as well as the expected emissions for 2010. Units ktonnes/year The emissions from Scenario 2010 have been used instead of the actual European emissions for the ten-year period. The results corresponding to those in Fig.1 are given in Fig.3. The results corresponding to those in Fig.2 are shown in Fig.4.
EXPOSURE TO HIGH OZONE CONCENTRATIONS
Numbers of days in which the ozone is higher than 120ppb.
Accumulated results 1989-1998 (Scenario 2010)

Above 4
3-4
2-3
1-2
Below 1Figure 3 Accumulated (for the period of ten years with Scenario 2010) numbers of days where the ozone concentration was greater than 120ppb in at least one hour
5. Main conclusions
Comparison of the results in Fig. 1 with those in Fig. 3 shows that if the emissions are reduced to the prescribed emission levels in Scenario 2010, then the danger of exceeding the first critical level in Denmark will practically disappear.
Comparison of the results in Fig. 2 with those in Fig. 4 shows, that if the emissions are reduced to the prescribed levels in Scenario 2010, then the exceedances of the second critical level in Denmark will be reduced considerably. However, there will still be great exceedances of up to three times above the critical level of 3000ppb.hours.
Of course, there are still many problems, which have to be solved. We shall here mention three of them, which in our opinion are important:
- Although some validation of the model results has been carried out (by comparing them with measurements; results from such comparisons can be found in Bastrup-Birk et al., 1997, in the WEB-site for the Danish Eulerian Model, 1999 and in Zlatev et al., 1996), many more comparisons with measurements are needed in order to verify better the reliability of the results. It must be emphasized here that it is not sufficient to validate only the ozone results, model results for some ozone precursors should also be verified.
- Comparisons of the results obtained by the Danish Eulerian Model with results obtained by other models could be very helpful.
- There is some evidence that the biological VOC emissions are strongly underestimated, Christensen et al., (1999), and that not only should biogenic VOC emissions from forests be considered, but also biogenic emissions from cultivated areas. Including such emissions in the model could make the ozone concentrations more insensitive to changes of the anthropogenic emissions. This means that better inventories for the biogenic emissions are needed when the effects due to different scenarios for the anthropogenic emissions are studied.
Finally, it should be emphasised that the model calculated data for the whole of Europe. In this study we have used only the data related to Denmark. However, similar studies can be carried out for all European countries.
EXPOSURE TO HIGH OZONE CONCENTRATIONS
Percentages: 100*AOT40C/3000
This figure shows the relative changes, in percent, of the AOT40C values in the period 1989-1998 (Scenario 2010)

Above 700
600-700
300-500
100-300
Below 100Figure 4 Exceedances of the averaged (over the period of ten years) AOT40C values obtained by using Scenario 2010 Acknowledgements:This research work was partially supported by NATO (ENVIR.CRG.930449, OUTS.CRG.960312 and ENVIR.ARW.971731), EU (ESPRIT, #22727 and # 24618) and NMR (the Nordic Council of Ministers) in a project in which teams from Denmark, Finland, Norway and Sweden are collaborating. A grant from the Danish Natural Sciences Research Council gave us access to all Danish supercomputers.
References
- M. Amann, I. Bertok, J. Cofala, F. Gyarfas, C. Heyes, Z. Kilmont, M.Makowski, W. Schop and S. Syri (1999), Cost-effective control of acidification and ground-level ozone, Seventh Interim Report, IIASA (International Institute for Applied System Analysis), A-2361 Laxenburg, Austria.
- A. Bastrup-Birk, J. Brandt, I. Uria and Z. Zlatev (1997), Studying cumulative ozone exposures in Europe during a seven-year period, Journal of Geophysical Research, Vol. 102, pp. 23917-23935.
- C. S. Christensen, H. Skov, P. Hummelshoj, N. O. Jensen, K. Pilegaard, B. Larsen and C. Lohse. (1999) Terpene emissions from vegetation measured by relaxed eddie accumulation, submitted to Atmospheric Environment.
- I. Dimov, Tz. Ostromsky, I. Tzvetanov and Z. Zlatev (1999), Economical estimation of the loses of crops due to high ozone levels, in: "Large-scale Computations in Engineering and Environmental Sciences" (M. Griebel, S. Margenov and P. Yalamov, eds.), pp. 273-280, Vieweg, Braunschweig, Germany.
- EMEP (1998), Transboundary acidifying air pollution in Europe: Part 1 - Estimated dispersion of acidifying and eutrofying compounds and comparisons with observations, Status Report 1/98, MSC-W (Meteorological Synthesizing Centre - West), Norwegian Meteorological Institute, P. O. Box 43 - Blindern, N-0313 Oslo, Norway.
- European Commission (1998), Amended draft of the daughter directive for ozone, Directorate XI: "Environment, Nuclear Safety and Civil Protection", Brussels, Belgium.
- R. M. Harrison, Z. Zlatev and C. J. Ottley (1994), A comparison of the predictions of an Eulerian atmospheric transport chemistry model with measurements over the North Sea, Atmospheric Environment, Vol. 28, 497-516.
- WEB-site for the Danish Eulerian Model (1999), http://www.dmu.dk/AtmosphericEnvironment/DEM
- Z. Zlatev (1995), Computer treatment of large air pollution models, Kluwer Academic Publishers, Dordrecht-Boston-London.
- Z. Zlatev, J. Christensen and A. Eliassen (1993), Studying high ozone concentrations by using the Danish Eulerian Model, Atmospheric Environment, Vol. 27A, 845-865.
- Z. Zlatev, J. Christensen and O . Hov (1992), An Eulerian air pollution model for Europe with nonlinear chemistry, Journal of Atmospheric Chemistry, Vol. 15, 1-37.
- Z. Zlatev, J. Fenger and L. Mortensen (1996), Relationships between emission sources and excess ozone concentrations, Computers and Mathematics with Applications, Vol. 32, No. 11, pp. 101-123.

Scientists' contributins [To Contents] [To Next Topic]